

🛡️The Shield Report
Weekly Market Monitor & Risk Analysis
The Bottom Line
Most investors buy an index fund and hope for the best. The Shield is the systematic upgrade to that strategy, designed to signal when the macro environment favors growth and when it's time to defend.
Current Status: 🟢 GREEN (Optimistic)
What this means: The macro trend is positive. Our monitors show the overall market is in a healthy state, making it a high-probability environment for being invested in equities.
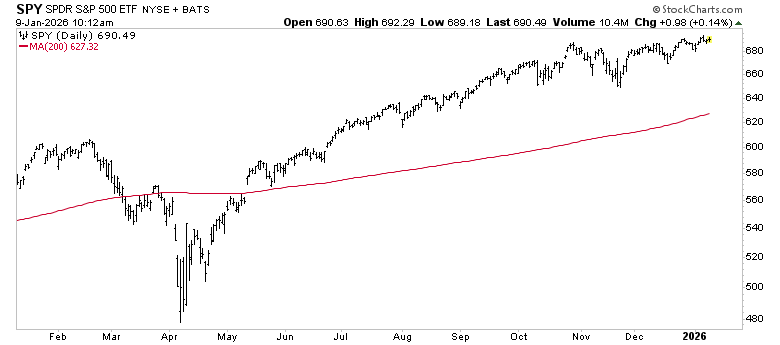
1. The Red Line | Long-Term Trend Review
We define the long-term health of the market by one simple metric:
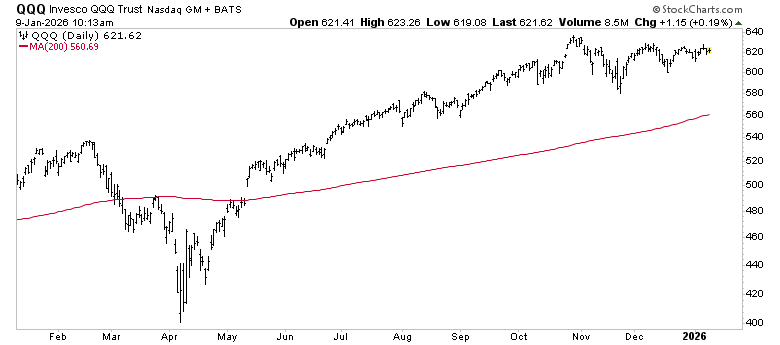
Is the price above or below the “Red Line” (the 200-day moving average)?
The Verdict: While “Buy-and-Hold” forces you to ride the market to the bottom, the Shield provides an objective risk signal. For now, the signal is clear: Stay Optimistic.
S&P 500 SPY 0.00%↑
Above the Red Line ✅
Nasdaq 100 QQQ 0.00%↑
Above the Red Line ✅
2. Momentum Trend Review (The Speedometer)
The Red Line tells us the direction; our momentum monitors tell us the strength.
If the Blue Line is above the Red line, the momentum trend is positive
S&P 500 SPY 0.00%↑
Positive ✅
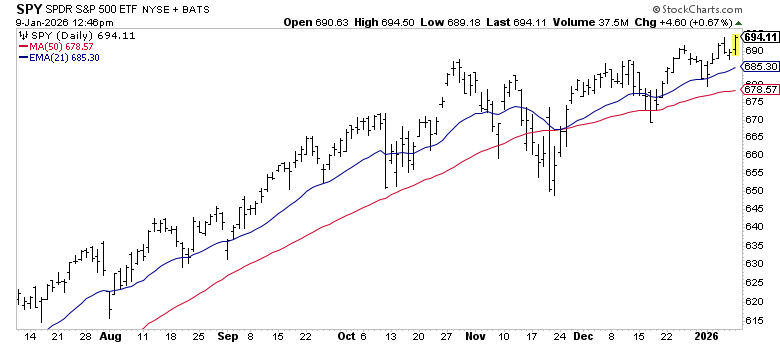
Advanced Analysis: After some decent strength to begin the new year, we are now seeing a continuation of “Higher Lows” form. Any pullbacks between current levels and November Low $650 support would be relatively normal, as that would be a ~6% pullback from current levels. Ideally, stocks continue to trend in Q1, and this $688 level becomes new support.
Nasdaq 100 QQQ 0.00%↑
Positive ✅
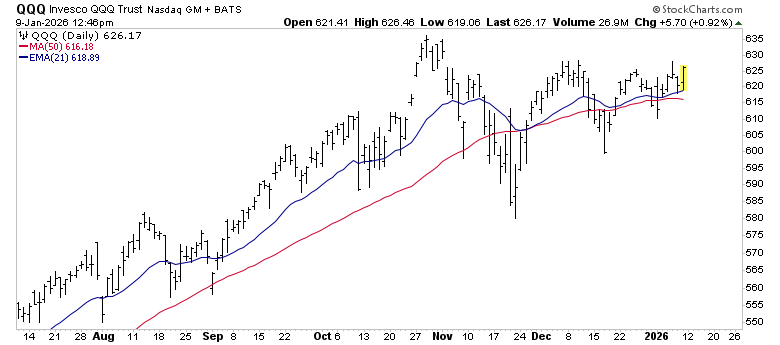
Advanced Analysis: As premium members can see from our Sword Rankings, tech continues to be a mixed bag. Mega-Caps like NVDA 0.00%↑ , META 0.00%↑ , MSFT 0.00%↑ continue to lag. These laggards account for ~20% of the Nasdaq 100. Meanwhile, promising breakouts are forming from in Financials and Healthcare, which have little to no representation in QQQ 0.00%↑ . Nevertheless, the trend is positive, price is making a series of higher lows, indicating this is an optimistic environment.
Know an investor stuck in “Buy-and-Hold”?
If you found this week’s Shield Signal helpful, don’t let your friends and colleagues navigate this market without a plan. Forward this report to one person who needs an objective risk management system.
🧠 Sentiment & Themes
The Rotation
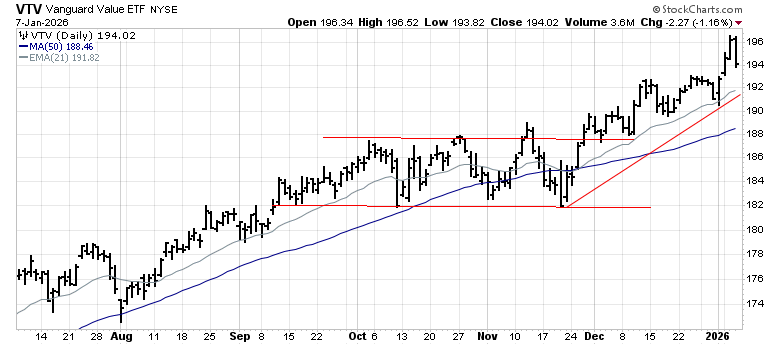
Value Stocks
Verdict: We are obviously seeing strength in value stocks - namely Healthcare and Financials leading the charge. GS 0.00%↑ and JPM 0.00%↑ breaking out to all-time-highs, and LLY 0.00%↑ , JNJ 0.00%↑ not far behind.
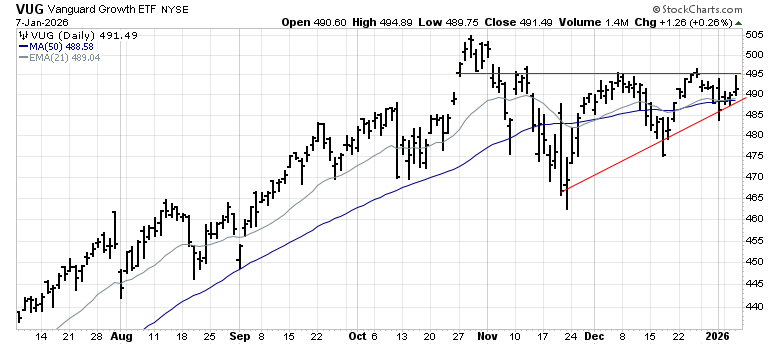
Growth Stocks
Verdict: Relative to Value, growth stocks are lagging. The important note is the difference between a downtrend and consolidation. When you look at the broad representation of growth stocks by VUG 0.00%↑ - this is not a downtrend.
Sector Spotlight: Financials (XLF)
The Chart: We think the chart speaks for itself here. Leadership in financials is clear. Led by GS 0.00%↑ and JPM 0.00%↑ .
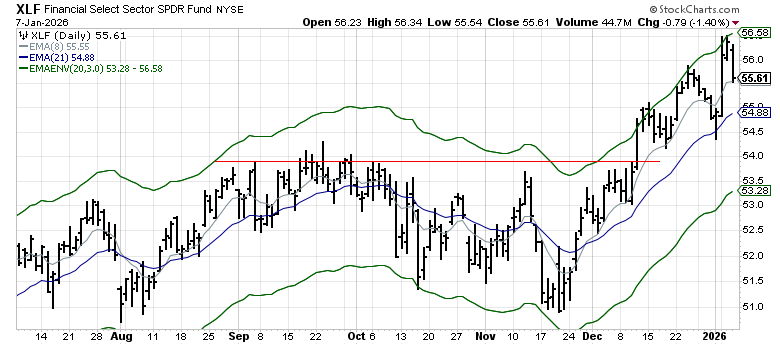
Technical View: Currently in a strong uptrend after clearing major resistance at $54.00. Rallies up to the upper moving average envelope (green) followed by minor pullbacks are a signal of a very healthy trend.
⚔️ The Missing Piece: The Sword Rankings
The Shield tells you where the market is trending. It doesn’t tell you who the leaders are.
While the “Buy-and-Hold” crowd focuses on diversification, our M5 Algorithm identifies the 5 specific leaders sitting firmly Above the Red Line.
5. Johnson & Johnson JNJ 0.00%↑
4. LOCKED
3. LOCKED
2. LOCKED
1. LOCKED
Stop holding the laggards. Start identifying the leaders.
See the full list free for 7 days.
Disclosures
Momentum Wealth Planning, LLC (“Momentum”) is a federally registered investment adviser under the Investment Advisers Act of 1940. Registration as an investment adviser does not constitute an endorsement of Momentum by the SEC nor does it indicate that Momentum has attained a particular level of skill or ability.
The information herein was obtained from various sources. The information provided is believed to be from reliable sources but no liability is accepted for any inaccuracies or completeness of information provided by third parties. The information in this communication is given as of the date indicated and believed to be reliable. Momentum assumes no obligation to update this information, or to advise on further developments relating to it. This is for information purposes and should not be construed as an investment recommendation. Past performance is no guarantee of future performance.
The material presented by Momentum Wealth Planning, LLC is for informational purposes only. It is not intended to serve as a substitute for personalized investment advice or as a recommendation or solicitation of any particular security, strategy or investment product. Actual economic or market events may turn out differently than as presented. Materials posted to this site are from external sources and are provided for your convenience in locating related information and services. Momentum expressly disclaims any responsibility for and does not maintain, control, recommend, or endorse third-party sites, organizations, products, or services, and make no representation as to the completeness, suitability, or quality thereof.