

To read our full disclaimer, click here
Moving Beyond “Passive” to a Risk-Management Plan
Most investors buy a broad index fund(s) and just hope for the best. But markets don’t work like this. Historical drawdowns of -20% to -50% aren’t uncommon, and it can often take 2 to 10 years just to get back to even when this happens.
For a passive investor, that’s a decade of lost time. For us, that is a risk we refuse to take without a plan.
The Shield is the plan in attempt to combat this. It tells you when the trend favors growth and, more importantly, when it’s time to manage risk.
Current Market Status: 🟢 Positive
The signals are favorable. The market trend is pointing up, making this a high-probability environment to be invested.
The Month-End Shield signal is the primary signal that we use to dictate our Hypothetical Model Portfolio
Paid members can access this below to see actionable ideas on how you could invest with the trend.
Not a paid subscriber yet? Start your Free Trial
🧠Cutting Through the "Noise"
We ignore the headlines and focus on the trend. This week, the media focused on:
The US Dollar falling
A new Federal Reserve Chairman Nominee
Silver & Gold Rush
AI Capex Concerns
Yet the trend was positive throughout January and stocks closed higher!
The Takeaway: If the headlines scare you, turn off the TV and look at the Red Line.
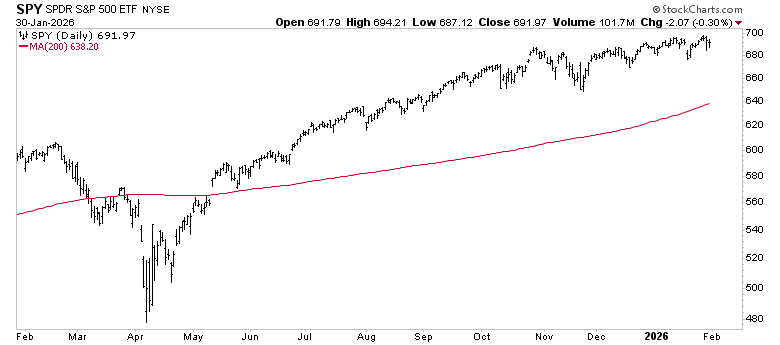
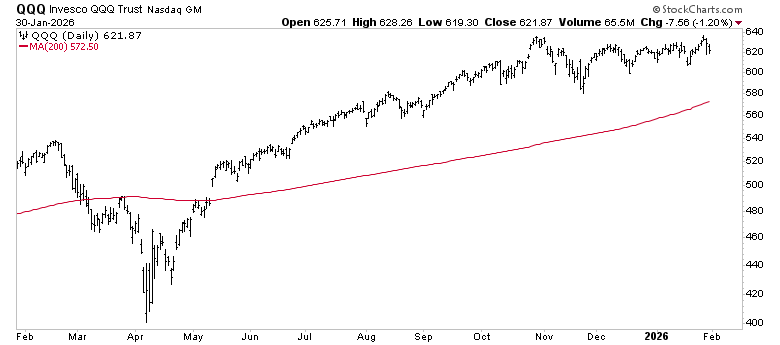
🛡️The Red Line | Long-Term Trend Review
We define risk using one primary metric: The Red Line (the 200-day moving average).
The Signal: If the price is Above the Red Line, we play offense (Buy/Hold). If it falls Below the Red Line, we play defense (Sell/Protect).
The Verdict: Both the S&P 500 (SPY) and the Nasdaq 100 (QQQ) are currently trading Above the Red Line ✅.
S&P 500 SPY 0.00%↑
Above the Red Line ✅
Nasdaq 100 QQQ 0.00%↑
Above the Red Line ✅
🛡️Momentum Trend Review (The Speedometer)
Think of this as the “speed” of the market. It measures the strength behind the price.
We track a faster-moving moving averages to track the market momentum.
Positive Momentum: When the Gray Line is above the Blue Line, the market has positive momentum.
Neutral/Lagging Momentum: When the Gray Line is below the Blue Line, the market has negative / neutral momentum.
S&P 500 SPY 0.00%↑
Positive ✅
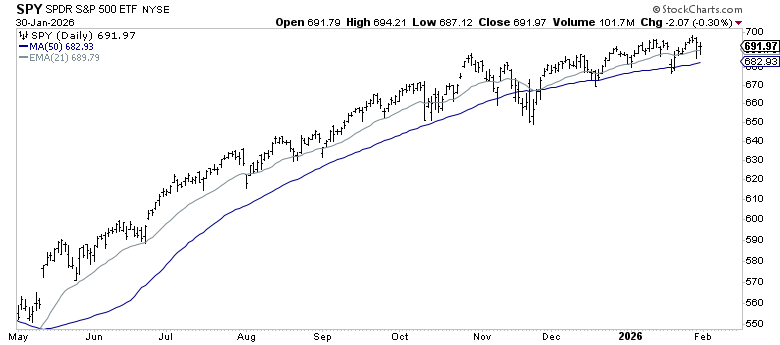
Advanced analysis: On Wednesday, the S&P 500 Index broke above all-time highs reaching the $7,000 mark. While it closed below these levels, we are still above the October 2025 high, which we would like to see become short-term support.
All that said, the past 2 weeks brought their fair share of headlines and geopolitical events - Greenland, Tariffs, Japan Government Bonds, Iran, etc. yet the market still managed to make new highs. Be prudent. Follow the trends, not the headlines.
Nasdaq 100 QQQ 0.00%↑
Positive ✅
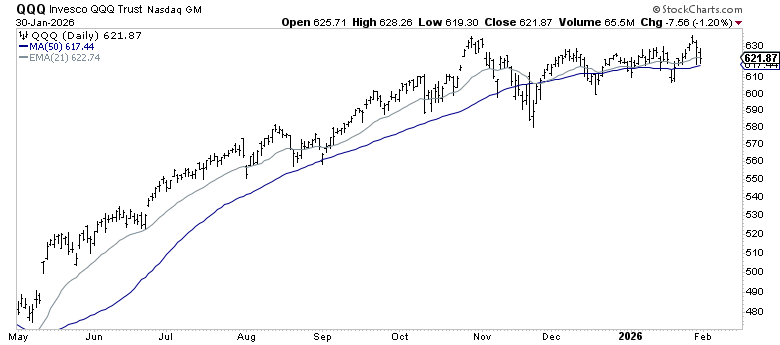
Advanced analysis: A more thematic analysis this month for the Nasdaq 100 QQQ 0.00%↑ the story of Tech vs. the broad market. Historically, our market leaders are found in the tech heavy QQQ, however it has been in a lull since the Nov. 2025 pullback. This past week, we had big earnings from MSFT 0.00%↑ , TSLA 0.00%↑ , META 0.00%↑ , and AAPL 0.00%↑ . These four giants make up ~17% of the Nasdaq 100.
Despite a mixed bag of said mega-cap earnings, the QQQ is above the red line with a positive momentum trend, indicating the broader market is making up for the few Mega-Cap laggards.
🛡️⚔️The Shield and Sword Hypothetical Model
The following section is reserved for paid subscribers of Momentum Wealth Research.
Investors are trained to seek predictions. What you should really seek is a process.
Upgrade now to see the MWR Hypothetical Model Portfolio, a hypothetical process designed to illustrate an action plan based on the Shield & Sword signals.
Trend: 🟢 Positive
Momentum: 🟢Positive
Current Model Hypothetical Positioning
