

🛡️The Shield Report
Weekly Market Monitor & Risk Analysis
To read our full disclaimer, click here
The Bottom Line
Most investors buy an index fund and hope for the best. The Shield is the systematic upgrade to that strategy, designed to signal when the macro environment favors growth and when it's time to defend.
Current Status: 🟢 GREEN (Optimistic)
What this means: The macro trend is positive. Our monitors show the overall market is in a healthy state, making it a high-probability environment for being invested in equities.
Market Review:
Earnings Season Kick-off: The big banks led the charge this week.
Inflation & the Fed: The latest CPI data came in softer than expected.
The Venezuela "boost" to Energy: Renewed geopolitical instability in Venezuela has tightened global supply expectations, providing a significant "kick" to domestic Energy leaders.
1. The Red Line | Long-Term Trend Review
We define the long-term health of the market by one simple metric:
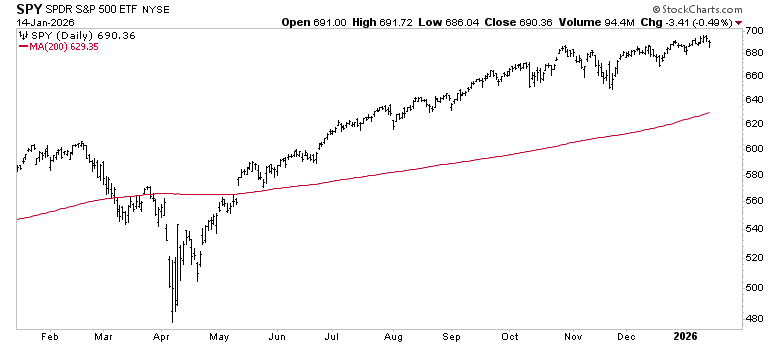
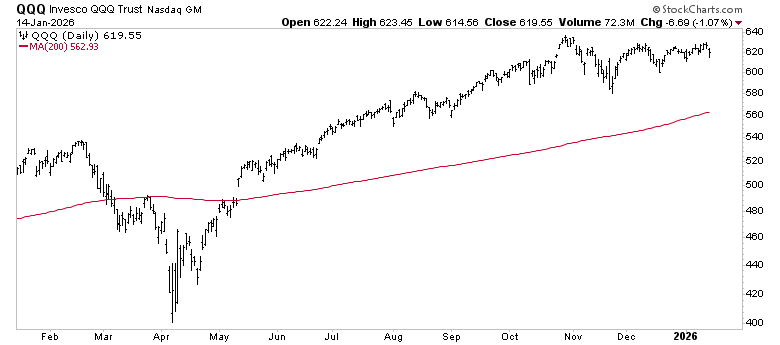
Is the price above or below the “Red Line” (the 200-day moving average)?
The Verdict: While “Buy-and-Hold” forces you to ride market volatility to the highs and the lows, the Shield provides an objective risk signal. For now, the signal is clear: Stay Optimistic.
S&P 500 SPY 0.00%↑
Above the Red Line ✅
Nasdaq 100 QQQ 0.00%↑
Above the Red Line ✅
2. Momentum Trend Review (The Speedometer)
The Red Line tells us the direction; our momentum monitors tell us the strength.
If the Blue Line is above the Red line, the momentum trend is positive
S&P 500 SPY 0.00%↑
Positive ✅
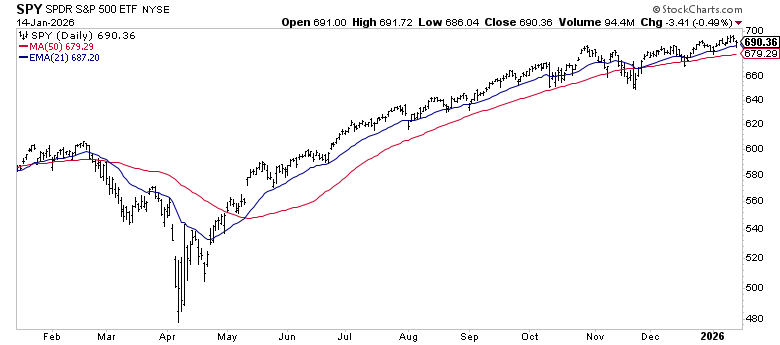
Advanced Analysis: We still seeing a continuation of “Higher Lows” form. Any pullbacks between current levels and November Low $650 support would be relatively normal, as that would be a ~6% pullback from current levels. Recent minor pullbacks have found support on the Blue 21-EMA, indicating a strong trend.
Nasdaq 100 QQQ 0.00%↑
Positive ✅
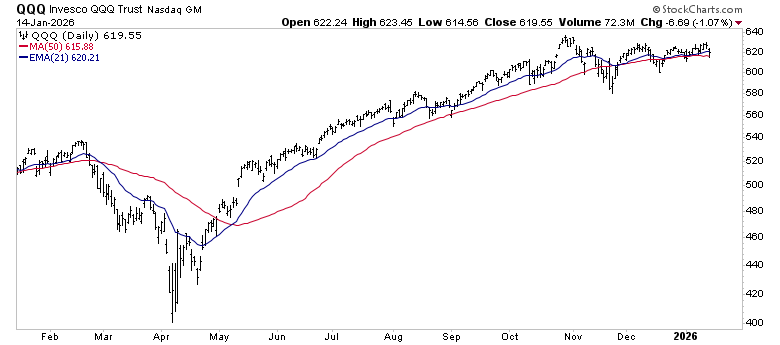
Advanced Analysis: The rotation out of Tech seemingly remains. While the SPY 0.00%↑ makes new highs, the QQQ 0.00%↑ is in a consolidation period. This is a very neutral trend and is helpful in determining where the leadership is which is driving the trend. Nevertheless, the Nasdaq 100 is weaker relative to the S&P 500 - it is still exhibiting positive momentum. If the mean reversion in Tech is to the upside, this could be a good opportunity.
Know an investor stuck in “Buy-and-Hold”?
If you found this week’s Shield Signal helpful, don’t let your friends and colleagues navigate this market without a plan. Forward this report to one person who needs an objective risk management system.
🧠 Sentiment & Themes
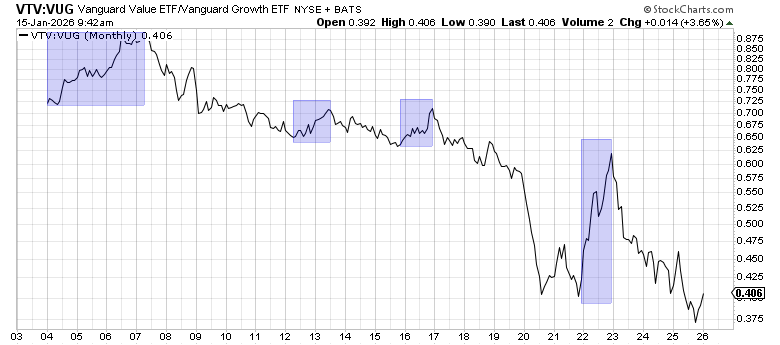
The Rotation
We highlighted this dichotomy last week, and it continues to be a primary focus in interpreting this market.
It is no secret that Growth tends to outperform Value. However, Value tends to have short bursts of relative outperformance, generally not exceeding a 12-month period. The chart below highlights Value’s relative outperformance of periods greater than 12 months. This occurred 4 times in the last ~23 years.
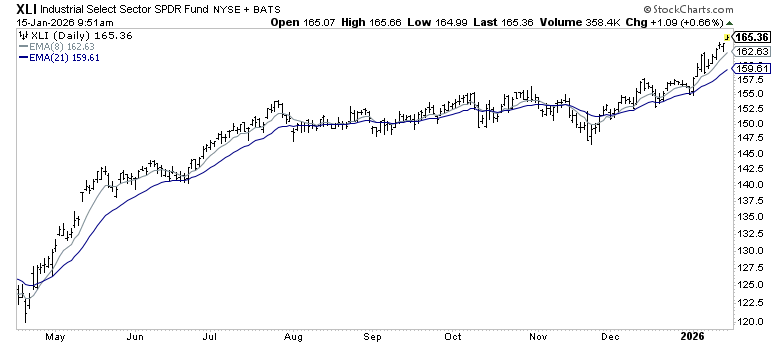
Sector Spotlight: Industrials (XLI)
Rotation: On theme with our Growth vs. Value dichotomy, Industrials XLI 0.00%↑ look excellent. Led by names such as GE 0.00%↑ , CAT 0.00%↑ RTX 0.00%↑ which are in very strong up-trends.
The Shield and Sword Hypothetical Model
The following section is reserved for paid subscribers of Momentum Wealth Research.
Upgrade now to see the MWR Hypothetical Model Portfolio, designed to illustrate the theoretical mechanics of the Shield & Sword system.
