

🛡️The Shield Report
Weekly Market Monitor & Risk Analysis
To read our full disclaimer, click here
The Bottom Line
Most investors buy an index fund and hope for the best. The Shield is a systematic addition to that strategy, designed to signal when the trend favors growth and when it's time to defend.
Current Market Status: 🟢 Positive (Optimistic)
What this means: The macro trend is positive. Our monitors show the overall market is in an up-trend, making it a high-probability environment for being invested in equities.
While headlines create daily volatility, the structural trend has not broken.
Addressing the Noise: This Week’s Context
We include these events only to address the “fear & greed” that dominates the financial media. While these are notable, they are secondary to the trend:
Japan Government Bonds: Japan’s rising interest rates are causing bond market volatility.
Greenland: Geopolitical tension has increased following the proposed 10%–25% escalating tariff on European countries.
The Credit Card Cap: A proposed 10% cap on credit card interest rates is creating localized pressure on the financial sector.
Signal Over Noise
Our system is built on the reality that the “noise” of news headlines and geopolitics is a distraction. While headlines explain why the market moved yesterday, the Trend tells you how to manage risk today.
In this system, the trend isn’t just a guide—it is the primary purpose. The only objective way to manage risk and remove emotion from your portfolio is to stay on the right side of the Trend.
We don’t manage news; we manage risk through the trend.
If the headlines scare you, turn off the television and look at the trend.
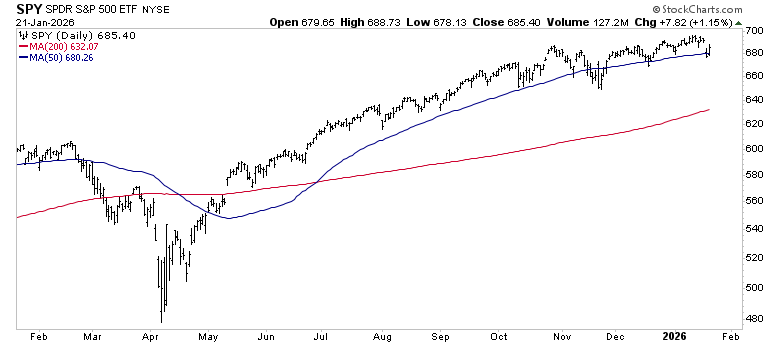
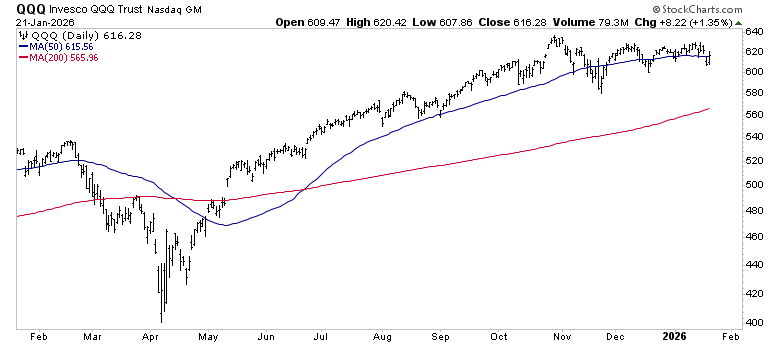
1. The Red Line | Long-Term Trend Review
We define the long-term health of the market by one simple metric:
Is the price above or below the “Red Line” (the 200-day moving average)?
The Verdict: While “Buy-and-Hold” forces you to ride market volatility to the highs and the lows, the Shield provides an objective risk signal. For now, the signal is clear: Stay Optimistic.
S&P 500 SPY 0.00%↑
Above the Red Line ✅
Nasdaq 100 QQQ 0.00%↑
Above the Red Line ✅
2. Momentum Trend Review (The Speedometer)
The Red Line tells us the direction; our momentum monitors tell us the strength.
If the Blue Line is above the Red line, the momentum trend is positive
S&P 500 SPY 0.00%↑
Positive ✅
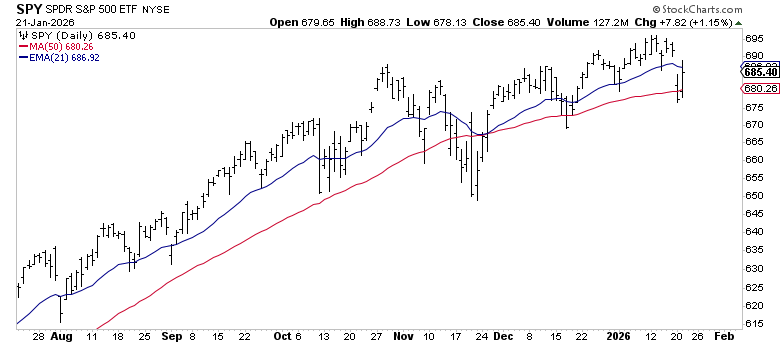
Advanced Analysis: We had a little volatility spike this week with the Japan / Greenland events, yet we still see a resilient momentum trend with a nice bounce-back today. Any pullbacks between current levels and November Low $650 support would be relatively normal, as that would be a ~6% pullback from current levels. Recent minor pullbacks have found support on the Red 50SMA line, indicating a strong trend.
Nasdaq 100 QQQ 0.00%↑
Positive ✅
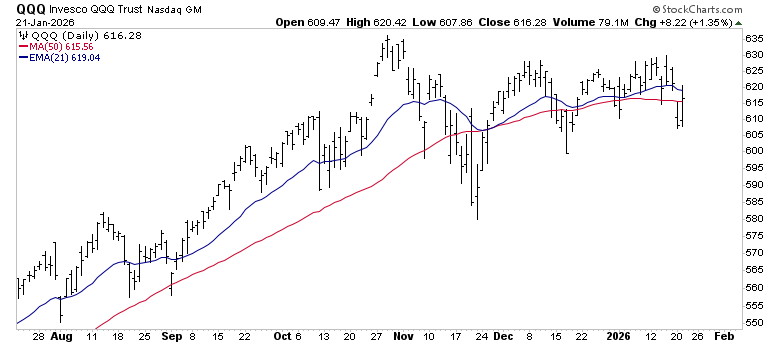
Advanced Analysis: Tech continues to lag. Closing today above the Red 50SMA line is encouraging considering the volatility yesterday. However, lack of leadership in MSFT 0.00%↑ META 0.00%↑ etc. makes things challenging. This remains in a neutral trend, correcting via time rather than price.
Know an investor stuck in “Buy-and-Hold”?
If you found this week’s Shield Signal helpful, don’t let your friends and colleagues navigate this market without a plan. Forward this report to one person who needs an objective risk management system.
🧠 Sentiment & Themes
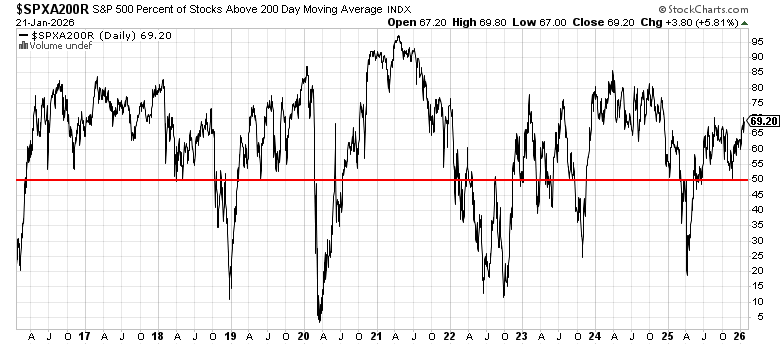
Breadth Continues to be positive
Despite yesterday’s volatility, today’s breadth remains strong and rising.
69% of S&P 500 stocks are ‘Above the Red Line’ (the 200SMA). Historically, a value above 50% is sign of an uptrend.
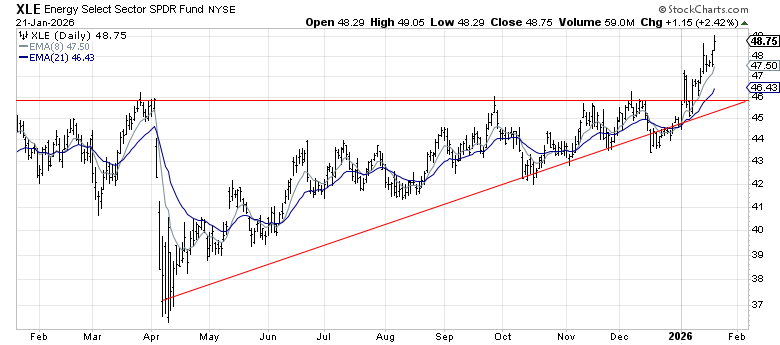
Sector Spotlight: Energy (XLE)
Fueling up: Jumpstarted by the Venezuela debacle, Energy stocks look terrific. Breaking above $47 which marked resistance for the past 2 years is a feat worth noticing. Led by XOM 0.00%↑ and CVX 0.00%↑. Recently making new all-time highs.

🛡️⚔️The Shield and Sword Hypothetical Model
The following section is reserved for paid subscribers of Momentum Wealth Research.
Upgrade now to see the MWR Hypothetical Model Portfolio, designed to illustrate the theoretical mechanics of the Shield & Sword system.
