Market Insights
Weekly analysis and commentary on macro trends, momentum themes, and what we're watching.
2026-04-11
The Myth of Diversification
Read more →
2026-04-01
The Red Line Flips: What History Says About Months Like This
Read more →

2026-03-16
March 2026 Week 2 | 10 Charts for the Week Ahead
Read more →
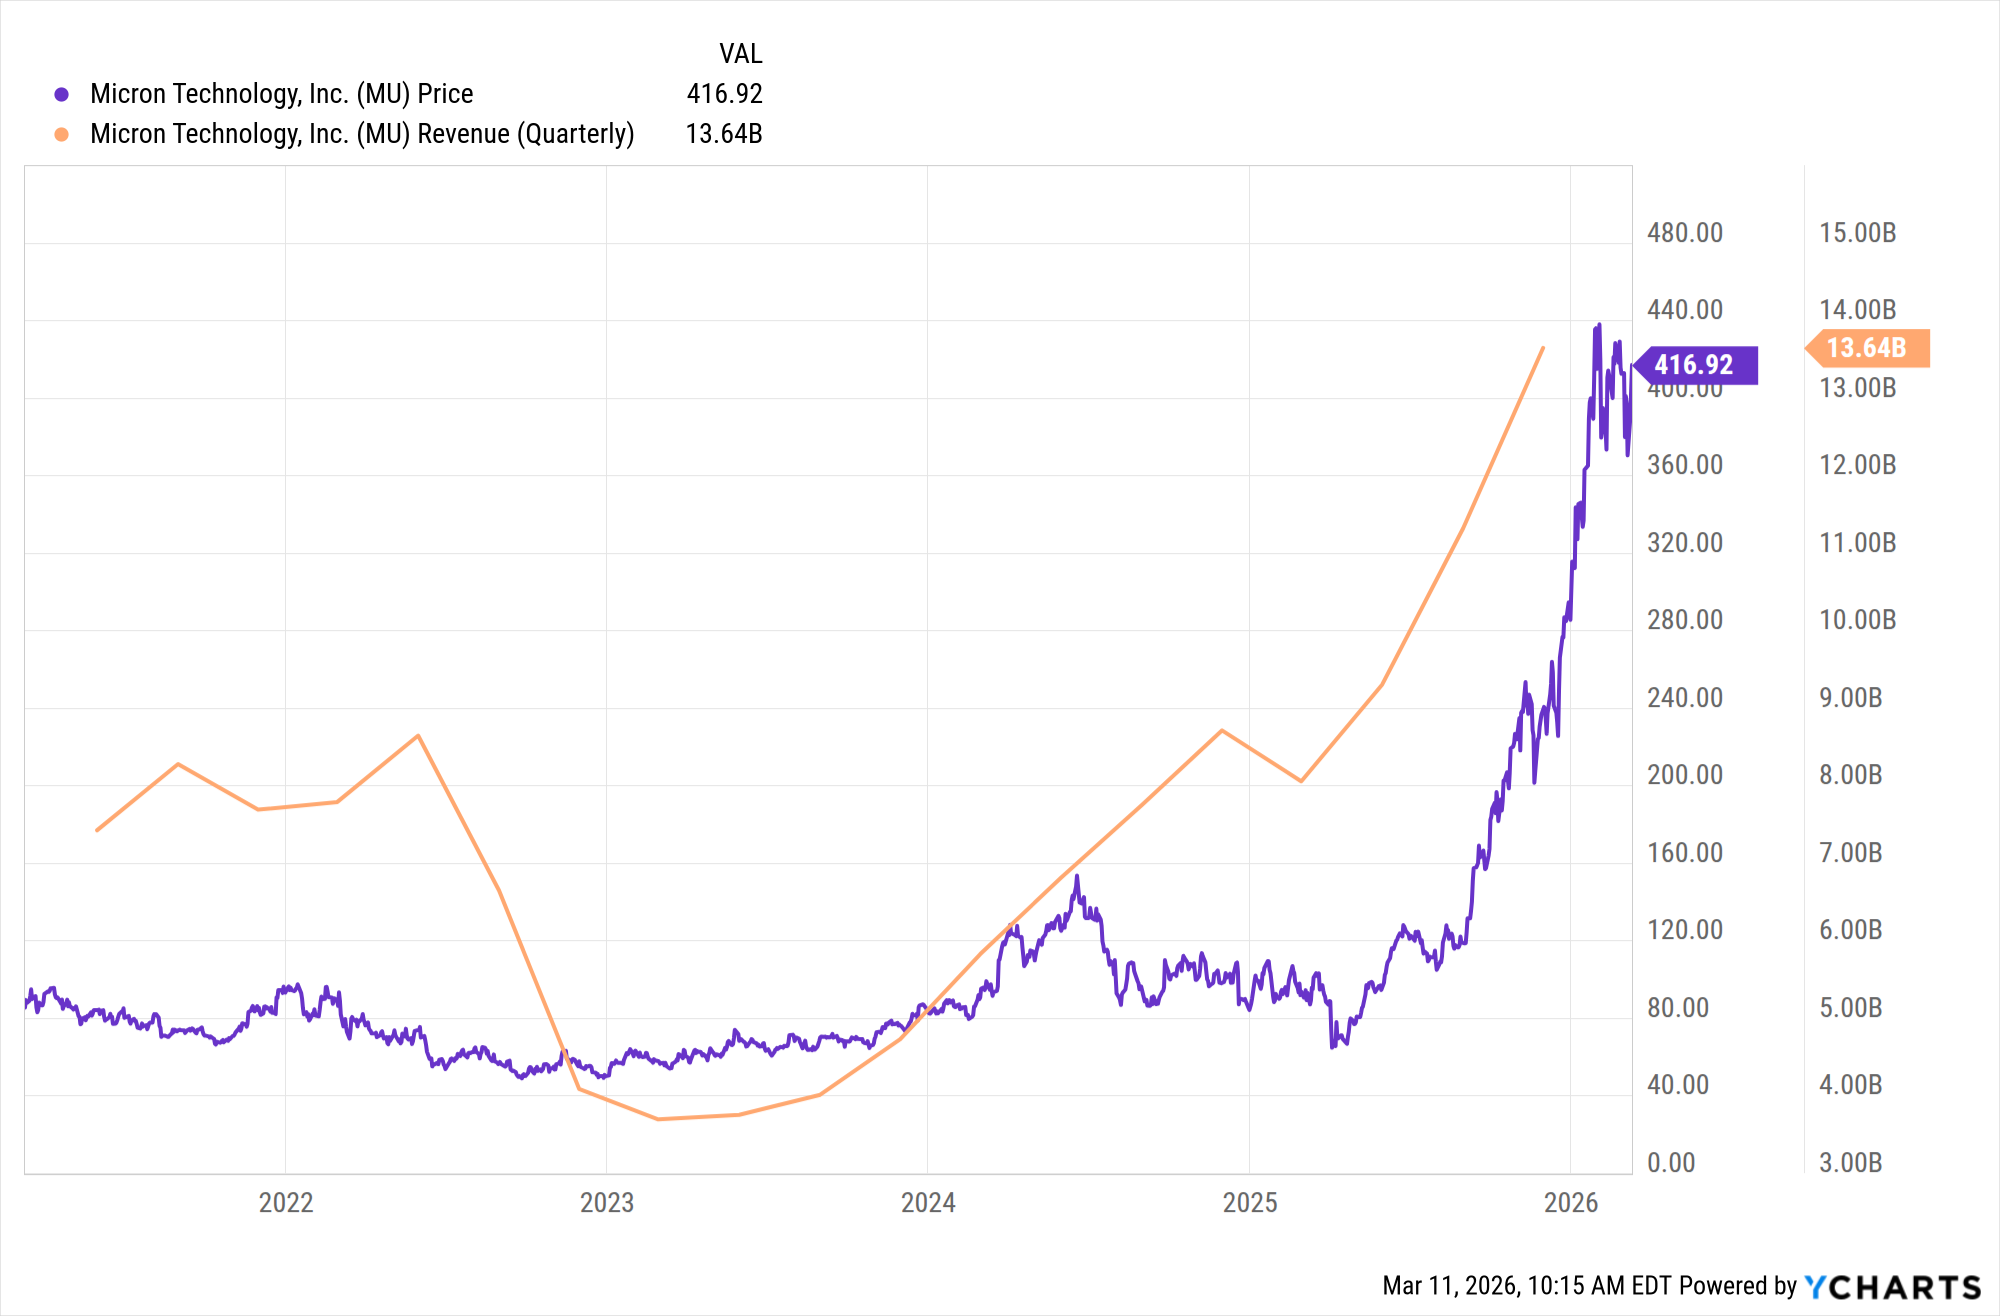
2026-03-12
Where the AI Money Is Actually Going
Read more →
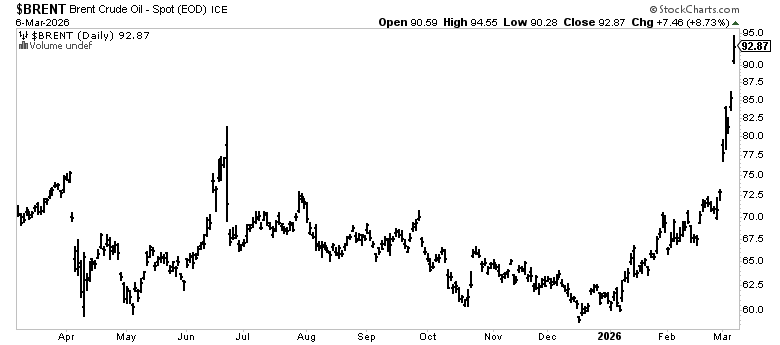
2026-03-08
Oil Just Broke $90 — What It Means for Stocks, Inflation, and the Fed
Read more →
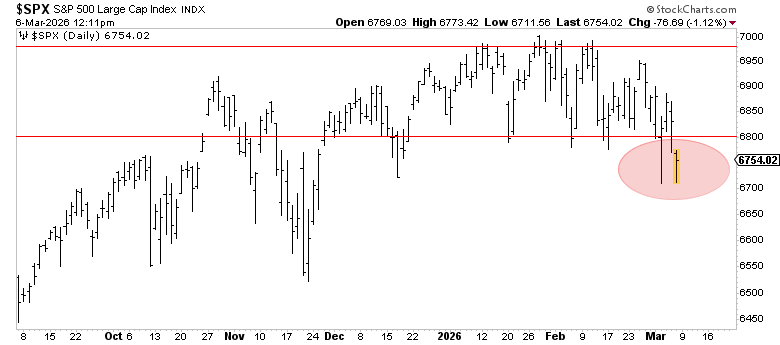
2026-03-06
March 2026 Week 1 | Crosscurrents, Cracks, and What the Data Says
Read more →